
A Bioinformatics-Based Study of
Angiotensin I Converting Enzyme 2 (ACE2) in Homo sapiens
Jeffrey Joseph and James Martinez
Published: December 17, 2020
THE GENE
The NCBI database provided all the proteins and nucleic acid sequences for this study:
(5) Chromosome X Assembly NCBI Reference Sequence: NC_000023.11
(6) Refseq Gene NCBI Reference Sequence : NG_012575.2
(7) Transcript Variant 2, mRNA NCBI Reference Sequence: NM_021804.3
(8) Isoform 1 NCBI Reference Sequence: NP_068576.1
(9) Transcript variant 5, mRNA NCBI Reference Sequence: NM_001388452.1
(10) Isoform 4 NCBI Reference Sequence: NP_001375381.1
The entirety of the following tables were created using the Reference GRCh38.p13 Primary Assembly as the set standard for genomic locations and gene length. Each intron and exon location was compared between both Assembly and Refseq Gene entries and were found to properly match. GRCh38.p13 Primary Assembly was inclusive of all five of the accepted Refseq transcript variants, this is in comparison to the Refseq Gene in which contained only four.
ACE2 Gene Tables
Table 1a
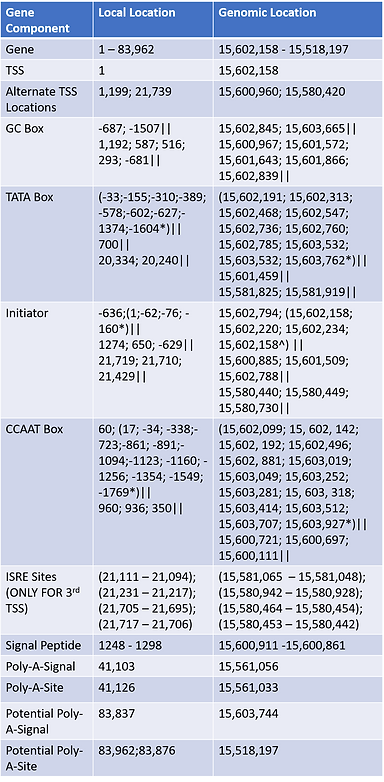
Tables 1a and 1b were split into two separate parts due to the large amount of exons/introns found within ACE2. Compiling the available pre-mRNA transcripts of all Refseq variants showed that the gene is 83,962 base pairs long and contains 21 distinct exons and 20 introns. Beneath each intron/exon are numbers corresponding to distinct Refseq transcripts in which were observed to contain those intron/exons.
Through the use of EPD, the gene was established to contain at least two distinct promoter regions with TSS's starting relative to the 1 and 1,199 bp positions. Relative to each promoter, several transcription motifs were discovered utilizing cut-off p-values of either .001 or .01 in extreme cases. Certain sections used a .01 p-value instead .001 p value due to very few motif hits. Identification of these less likely motifs by .01 p are presented by "*" in the table. A third promoter was recently discovered with a TSS located at 21,739 bp; this promoter region is solely used by RNA transcript 5 and is noteworthy for being used in response to interferons in comparison to other promoter regions. The distinct isoform made by variant 5 has been referred to as dACE2 and isoform 4. To allow distinction of what motifs correlated to which promoter, "||" was used to separate the first, second, and third promoter in that order. Signal peptide and Poly-A-Signals/Site were confirmed through the Primary Assembly and were reassured by the Refseq Gene. A potential Poly-A-Signal/Site was inferred through sequence analysis of the Refseq transcript variant 3 due to the fact that it did not share the same ending exon of the other 4 transcripts.
Table 1b

ACE2 Gene Diagram

5'
3'
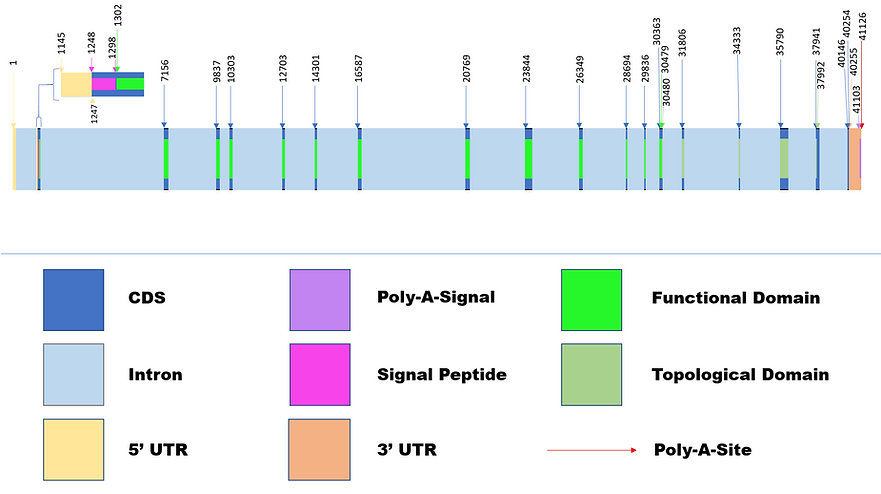
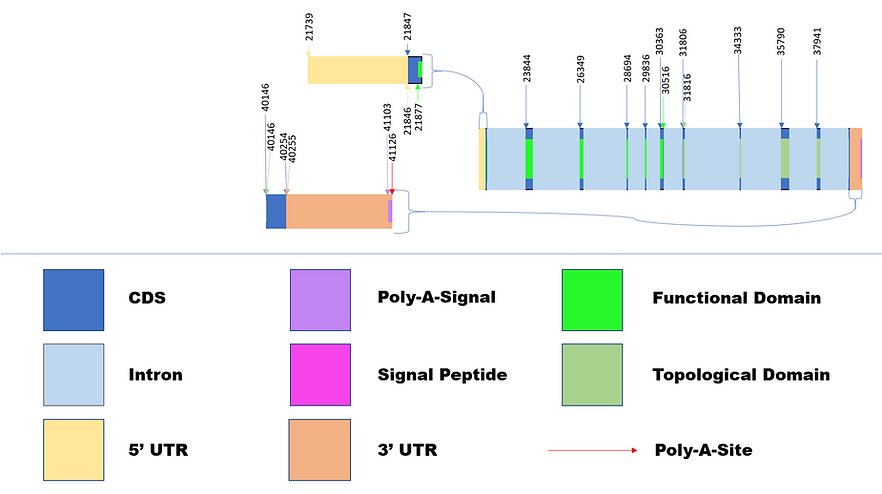
Diagram 1 is based on an amalgamation of all reviewed NCBI Refseq transcript variants 1 through 5. It follows a majority of the gene table, however it is to note that placement of known exon areas affected the appearance of alternative introns. For observation of how mRNA transcripts fit in the gene diagram, referencing local location and variant association from the gene table will work. The gene diagram presents three distinct TSS sites at 1, 1199, and 21,739 bp with 2000bp promoter regions for each. Promoter motifs are indicated by certain colored arrows and by observing each promoter region we can observe that the first most promoter contains a majority of the transcription factor binding sites. The first exon(203 bp) is noted to be exclusively present in Refseq transcript variant 2 and known to increase the 5’UTR. Comparison of pre-MRNA transcripts show that transcript variants (1,2,3,4) share the same ending of the 20th exon. The final exon and intron on the diagram correspond to alternative intron 18 and exon 21 on the gene table in which are exclusively found in Refseq transcript variant 3. The gene itself is observed to contain relatively small exons with larger introns, examples being exon 3 length being 97 bp and the final intron being 45,043 bp. Notable features of this gene diagram are enlarged for better visualization, the first enlarged image presents the possible alternative exon extension of exon 2 (234 bp) by 54 base pairs found only in Refseq transcript variant 2. The second visualization presents the Interferon Sensitive Response Element binding sites only found in the Refseq transcript variant 5 also known as dACE2.
Decision of which two of the five reviewed ACE2 transcript variants were to be further studied was based upon each of their isoforms relationship with SARS-CoV-2, transcript variants 2 and 5 were selected. Selection of transcript variant 2 was due in part for its ability to code for the fully functional isoform 1(850 aa) as also seen in transcript variant 1. The end decision between transcript variant 1 and 2, was based on its unique extended 5’ UTR region in which the Primary Assembly shows is the product of the first possible TSS on the gene. Transcript variant 5 was selected due to its creation of isoform 4(459 aa) through interferon stimulation, which allows for prevention of proper SARS-CoV-2 binding. The importance of the two transcript variants provided is their clear differences in possible receptor functionality with the presence of SARS-CoV-2.
ACE2 pre-mRNA/Isoform Composite Tables 2a & 2b
Table 2a
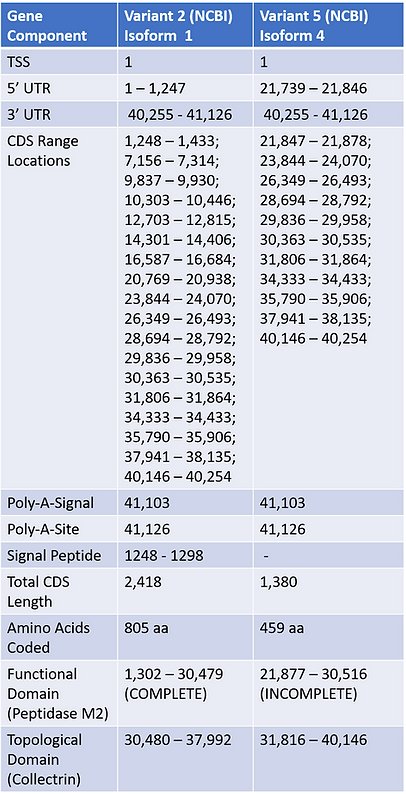
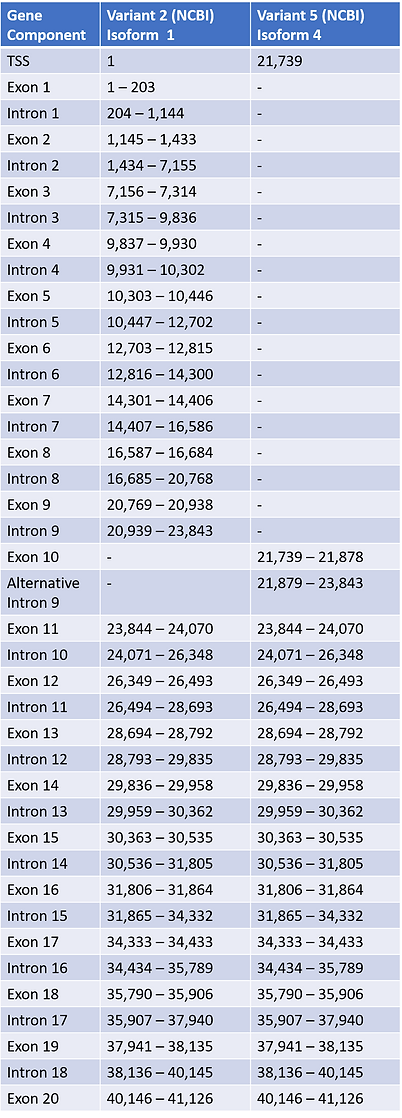
Table 2a and 2b are pre-mRNA/isoform tables in which have been compiled using the information obtained in the Table 1a and 1b to present the exons/introns of the selected variant isoforms. Other information on exact CDS and UTR regions were found by using the ACE2 NCBI Full Table option which produces lists of such data from the GRCh38.p13 Primary Assembly. The 5’UTR’s for Transcript Variant 2 and 5 were found respectively from parts of exons within locations 1 - 1,247 bp and 21,739 - 21,846 bp. Both transcript variants held the same 3’ UTR region locations of 40,255 - 41,126 bp. Analysis of mRNA transcript variants in comparison to the Primary Assembly revealed that they also maintained the same polyadenylation signal/site. Transcript variant 2 was clearly larger than transcript variant 5, and it contained more CDS sites in which allowed it to code for the full 805 amino acid isoform 1 in comparison to the truncated 459 base pair isoform 4. Observation of conserved domains within each isoform was first performed utilizing Uniport before NCBI, in the search we decided to utilize the reported conserved functional domain of Isoform 2 from Uniport solely because of reliability, and then used NCBI for Isoform 4 due to missing Uniport information. Topological Domain was determined solely on NCBI Conserved Domain entries.
Table 2b
ACE2 pre-mRNA/Isoform Diagrams
Diagram 2: Variant 2 & Isoform 1
5'
3'
Diagram 3: Variant 5 & Isoform 4
5'
3'
Diagrams 2 and 3 were created based on their respective sections on Table 2a and 2b. The loss of 8 distinct CDS regions found in the truncated isoform 4 resulted in the loss of functionality in the M2 peptidase domain in which carries out metallopeptidase activity and importantly acts as the receptor to SARS-CoV-2. Transcript Variant 2 is noted to maintain the active functional domain and is prone to attaching to the virus. The location of the Collectrin topological domain of each found isoform was found using NCBI Conserved Domain Database, and both were found to maintain its functionality as a transmembrane stabilizer. The Collectrin domains were in different locations, Isoform 1 has it located in 30,480 - 37,992 bp and Isoform 4 in 31,816 - 40,146 bp. The distinct CDS location similarities of the two transcripts after 23,844 bp are noticed.
Following the creation of the gene diagram and pre-mRNA/isoform diagrams from peer-reviewed Refseq entries, exploration of experimental/unreviewed entries was conducted using the Ensembl database in which contained 10 entries with 7 new additional transcript variants along with 3 transcripts matching reviewed Refseq entries. In order to best arrange the list of all found transcript variants/isoforms, the first five rows were organized to display the corresponding Refseq entries. The sixth row and beyond were assigned placeholder variant numbers for Ensembl entries, however the isoform column is utilized to provide the corresponding Ensembl entry numbers. Data in the isoform column enclosed by parentheses are supposed to represent ACE2-(...), which is the naming system used by Ensembl. Since a few entries matched both databases, their NCBI and Ensembl entry number were placed and separated by a ":" in the isoform column.
ACE2 Isoform Comparison Table
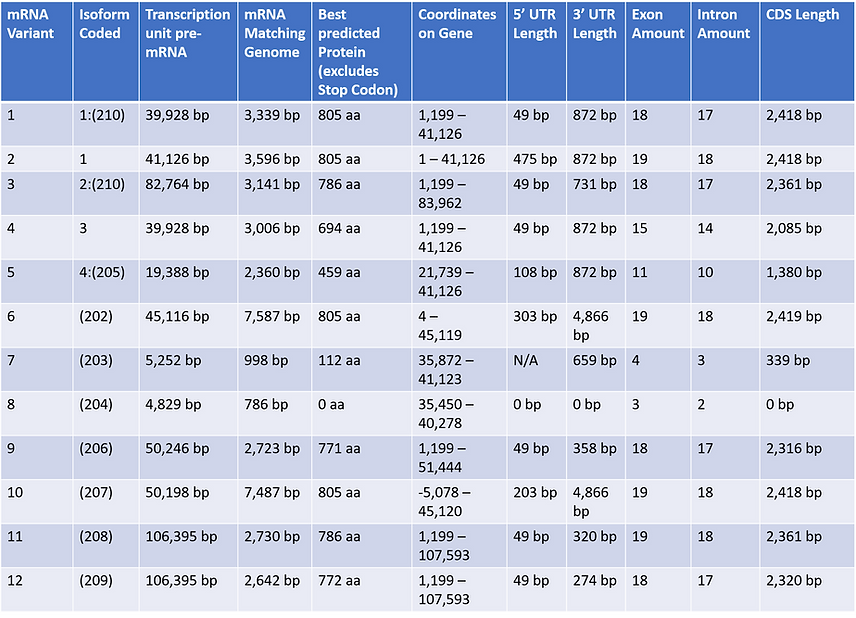
TABLE 3 presents 12 total isoforms for the ACE2 gene. Observing the transcripts it appears that pre-mRNA transcript length doesn't seem to correlate to overall size of amino acid coded. The amount of total exons produced in the mRNA variant did correlate to a higher amount of CDS's which usually coded for the complete 805 amino acid isoform. It is also observed that transcripts in which contained larger 3' UTR's usually coded for complete amino acid isoforms, for example variant (202) with a 3' UTR of 4,866 bp generated the full 805 amino acid protein successfully. A couple of the given entries were observed to code for bad proteins, isoform (208) and isoform (203) for example were found to go through nonsense mediated decay after their synthesis. mRNA transcript 8 was especially peculiar since its transcript comprised of 3 exons, however none were coding sequences so it didn't produce an actual protein. Observation of the TSS locations seems to imply other possible start sites, along with that it appears that the TSS located at 1,199 bp and 5' UTR length of 49 bp are similar qualities for a majority of the transcripts. It appears as if most code for normal functioning ACE2 proteins except for those in which share a similar start site to Isoform 4 that are notably non-functional. Possibly the interferon response found in ACE2 may show that in presence of viruses ACE2 may either code for transcripts with non-functional binding domains or code nonsense transcripts in which won't even produce a peptide.
Gene Expression
Cells/Tissue Expression in Isoform 1:
-
Endothelial Cells
-
Enterocytes
-
Arterial Smooth Muscle Cells
-
Leydig cells and Sertoli cells
-
Nasal goblet secretory cells
-
Intestinal Epithelial Cells
-
Heart
-
Kidneys
-
Lungs
-
Testis (14)
Isoform 1 is the primary isoform for ACE2 and is the one that is most expressed in various cells/tissues of the body. Research has shown that although ACE2 mRNA is expressed in various tissues of the body, protein expression by those mRNA variants is not that well known (16). Experimental studies have shown that Isoform 4 expression can be seen in the lungs, gastrointestinal tract, and urogenital tract, but evidence is limited (13). According to UniProt and PubMed, some of the top cells/tissues that ACE2 is expressed in are listed above. ACE2 can primarily be found expressed in endothelial cells, which are cells that form the linings of blood vessels such as the arteries and capillaries. Since ACE2 is known for cleaving hormone peptides that are found in the blood stream such as angiotensin I &II, it makes sense that ACE2 is expressed on the cell membranes of endothelial cells.
ACE2 is also highly found within the cells of the intestinal lining known as enterocytes. ACE2 is prevalent within the tissues of the intestine because it takes part in neutral amino acid transport that occurs within the gut lumen (the exact pathway is described in the protein function section). Moreover, with the prevalence of the SARS-CoV-2 virus, scientists were able to recognize various tissues/cells targets that ACE2 can be found on. Two examples of these identified tissues with high expression of ACE2 are the nasal cavity and the lungs, in which were identified by SARS-CoV-2/ACE2 binding.
Development Related Differential Expression
Timed developmental gene expression was first searched through the use of Ensembl and was identified to occur. Website failure of their gene expression atlas at the time of this write up however, has led us to infer isoforms in which participate in timed developmental gene expression. Using the gene expression tab on the NCBI ACE2 gene page, a project called “Tissue-specific circular RNA induction during human fetal development” could be found. The project utilized RNA-sequencing to categorize relative mRNA levels in different tissues during fetal development. The chart itself is able to show different expression levels during development from tissue of the intestine, heart, and stomach. To possibly identify which isoform could be related to such an event, Aceview was used to compare transcripts with their most associated tissue. The conclusion of the search was that isoform 1 of ACE2 was the only candidate due to it’s high expression presence in small intestine tissue. For the chart, intestine samples at 10 weeks display a very low expression level(1 RPKM) which decreases going onto the 11th week(3 RPKM). The 15th week is observed to have a large increase in overall expression(36 RPKM), with the 17th week again decreasing its expression level(7 RPKM). The final expression rate observed was for week 20 in which had the largest of the previous results, although also had a large margin of error. It is assumed that gene expression patterns in the small intestine may have to do with the functionality of the protein’s M2 peptidase domain. The M2 peptidase has the possibility of targeting early made proteins in which it could cleave or remodel the structure. The utility of having specified proteins during development progression may require overexpression of the ACE2. (17), (18)